Please use an RMarkdown file to complete this assignment. Make sure you reserve code chunks for code and write out any interpretations or explainations outside of code chunks. Submit the knitted PDF file containing your code and written answers on Canvas.
Questions
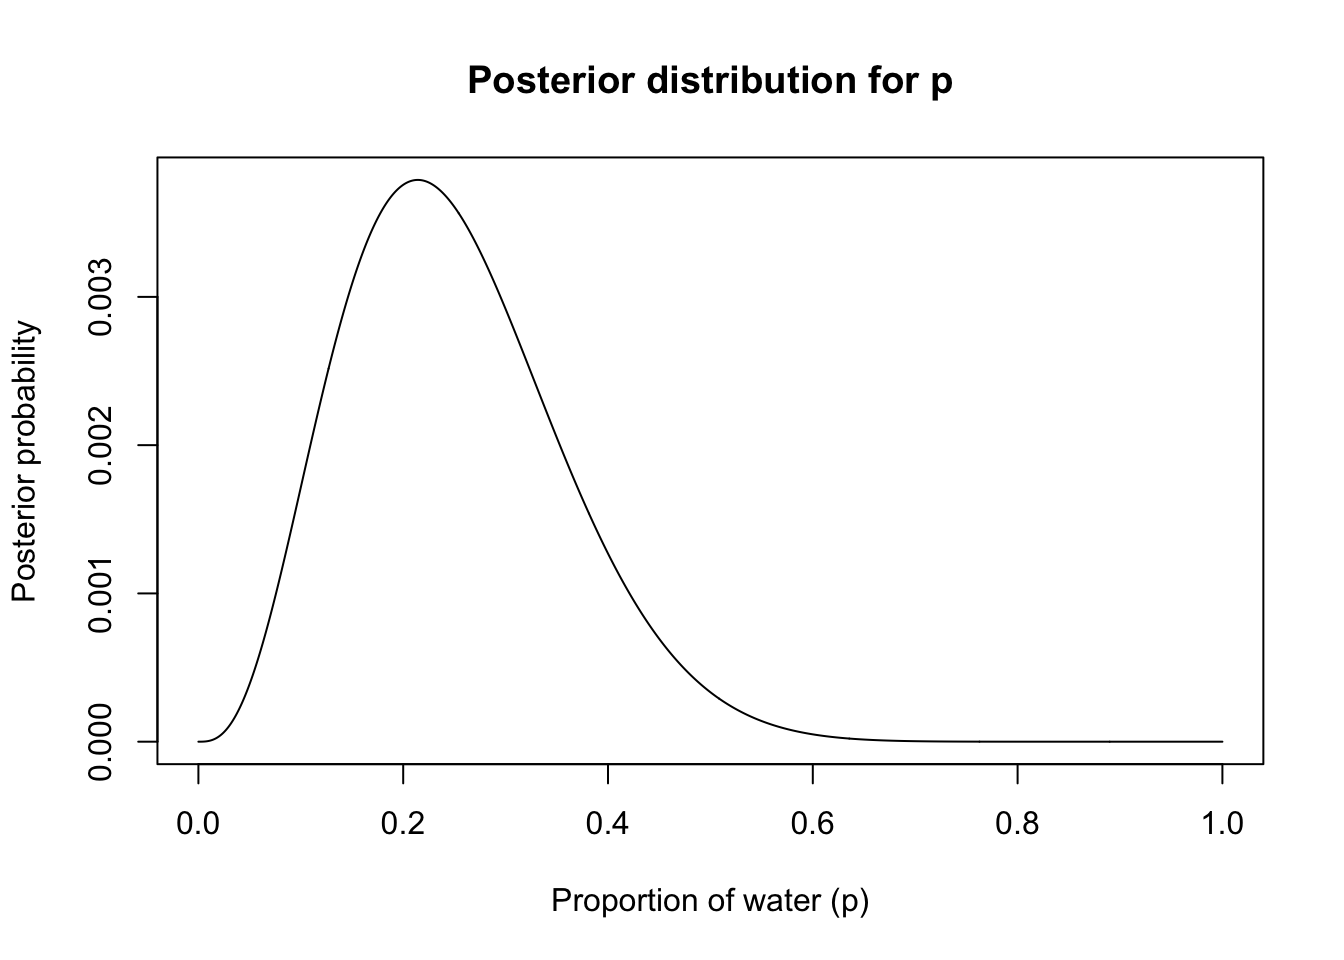
Suppose the globe tossing experiment turned out to be 3 water and 11 land. Construct the posterior distribution.
Click to see the answer
# Create a sequence of p values from 0 to 1p_grid <-seq(0, 1, length.out =1000)# Prior (uniform)prior <-rep(1, 1000)# Likelihood (binomial)likelihood <-dbinom(3, size =14, prob = p_grid)# Posterior (proportional to likelihood * prior)posterior <- likelihood * priorposterior <- posterior /sum(posterior)# Plot the posteriorplot(p_grid, posterior, type ="l", xlab ="Proportion of water (p)", ylab ="Posterior probability",main ="Posterior distribution for p")
The posterior distribution shows the probability of different values of p (proportion of water) given our data (3 water, 11 land). Since we used a uniform prior, the posterior is proportional to the likelihood. The peak of the distribution is around p = 0.21, which makes sense given our data (3/14 ≈ 0.21).
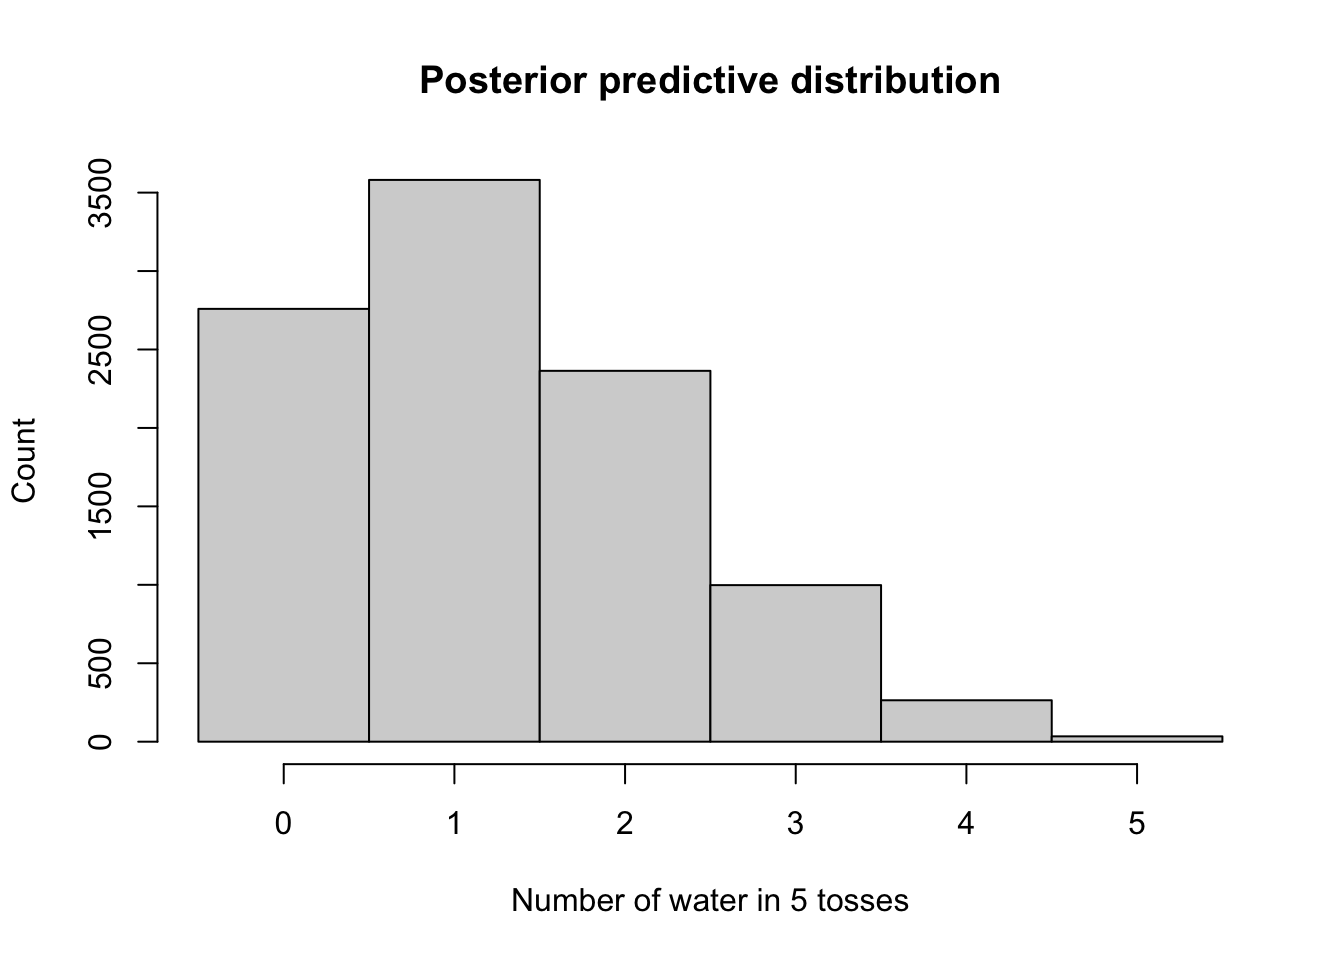
Using the posterior distribution from 1, compute the posterior predictive distribution for the next 5 tosses of the globe.
Click to see the answer
# Number of samples from posteriorn_samples <-10000# Sample p values from posteriorp_samples <-sample(p_grid, prob = posterior, size = n_samples, replace =TRUE)# Generate predictions for 5 tossesn_tosses <-5predictions <-rbinom(n_samples, size = n_tosses, prob = p_samples)# Plot the posterior predictive distributionhist(predictions, xlab ="Number of water in 5 tosses",ylab ="Count",main ="Posterior predictive distribution",breaks =seq(-0.5, 5.5, by =1))
The posterior predictive distribution shows the probability of different outcomes for the next 5 tosses, taking into account our uncertainty about p. The most likely outcome is 1 water (since our posterior mean for p is around 0.21, we expect about 1 water in 5 tosses). The distribution is right-skewed because p is less than 0.5.
You can download a template file here to help you get started.